![]()
Voyant Tools is a free, open-source application that combines many basic tools for text analysis: frequency lists, keyword extraction, topic modelling, collocation detection, etc. Its accessibility and flexibility make Voyant one of the most popular tools for Digital Humanities research, and you can find dozens of examples, such as researching trends in science fiction literature.
Voyant Tools offers a web version at https://voyant-tools.org/, and a desktop version downloadable from the developers' GitHub. To start exploring, simply Open one of the sample corpora (Shakespeare's plays, Jane Austen's novels and Mary Shelley's Frankenstein) or Upload your own one on the tool's home page, and then click Reveal.

The following settings are located in the top right corner of the upload box:
All the main tools — word clouds, trends, KWIC, document statistics — are located on the main screen, divided into panels.


Each panel can be customised and changed. There are many different tools available than are first visible. To export, change, or learn more about a panel, hover your mouse over the grey line at the top and menu items will appear.

The search window in every panel supports the same search query syntax.

Compiling word frequency lists is one of the main features of Voyant Tools. For each lexeme, or term, VoyantTools calculates its absolute and relative frequency in the document and in the entire corpus. Based on these, word clouds and trends (graphs showing the change in word frequency from document to document) are compiled.
By default, a frequency list for your corpus is located in the second tab of the top left panel. The Trend column shows the use of each term in different documents within the corpus as a little graph, where documents lie on the X axis (in the Shakespeare corpus, they are ordered chronologically), and the Y axis is the absolute term frequency.

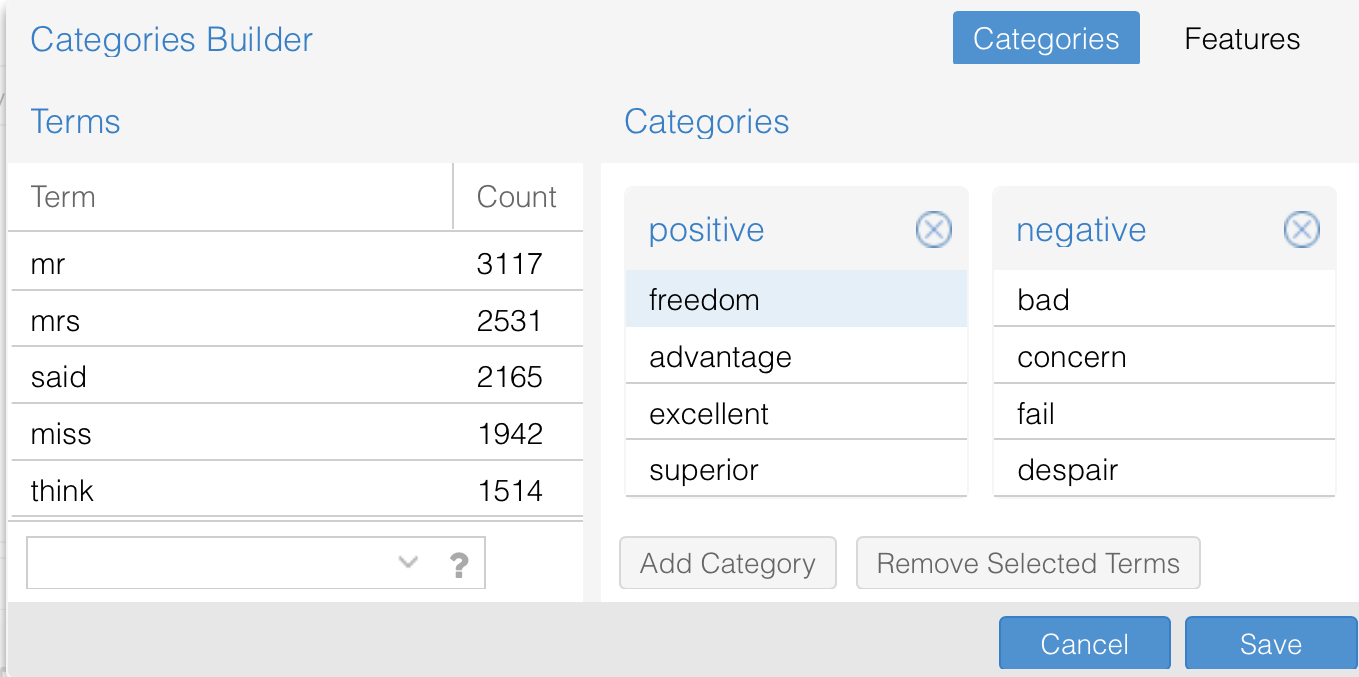
Each term can have a category label. There are two built-in ones, @positive and @negative, highlighted in green and red respectively.
Place the cursor in the search field at the bottom of the tool above and try each of the following searches, one at a time (remove the previous search term before entering a new one):
positive: this is each occurrence of the word "positive" in the text (only 3 in the Shakespeare's plays corpus)@positive: this is the aggregate number of occurrences for all words in the positive categories group (37,763)^@positive: this shows the frequencies for each word in the positive categories group (925)
You can create your own categories and colour schemes for them by clicking on the Options icon. Once you click on the Options icon then you should see a Categories control, a box in which you can copy and paste values (categories are transferable between corpora), as well as an Edit button that allows you to edit the specified list.

Voyant Tools automatically filters stop words (conjunctions, prepositions, particles, etc.) for some languages, including English and Irish. The built-in list can be updated through the Options tab of the Cirrus panel by clicking the Edit List button. You can also create your own stop list from scratch. The Options button looks like a slider and is located between the question mark and the Windows icon.


The Cirrus panel is a visualisation of the most frequent words in a document in the form of a word cloud, where the size of a word is determined by its frequency in the document. Using Scale, you can choose to display the cloud for the entire corpus or for individual documents. Using the Terms slider, you can adjust the number of words in the cloud. You can also customise the appearance of your word cloud, selecting font family and palette in the Options menu.

You can also export your visualisation by clicking the Export menu button. This option is available for every tool!


The Trends panel shows the frequency of words in each document. It allows you to visualise several words for comparison. From the Display menu you can choose a convenient graph view.


In addition to individual words frequencies, you can explore the relationships between words.
Links tool is located in the third tab in the top left panel by default. It shows a network graph of higher frequency terms that appear in proximity. Keywords are shown in blue and collocates (words in proximity) are showing in orange. Features include:

TermsBerry tool is located in the second tab of the top central panel, beside Reader. It provides the same visualisation of frequency words as Cirrus, but is more useful for exploring collocates. Hovering over a word highlights words that occur near the selected word. How far away a word must be from the selected term to be considered a neighbour can be adjusted with the Context slider. The Strategy tab lets you switch between frequent words and “significant” words that may be rare overall, but appear much more frequently in certain documents than in others.

By default, this panel is located in the first tab in the bottom right corner. This tool lets you view the context of a word with a custom window size in the KWIC (key word in context) format, common for linguistic corpora.

Collocates tool is located in the second tab in the bottom right corner. It shows stable combinations of two words in the whole corpus and in individual documents.

To open the Correlations tool, go to the bottom right panel, click the Windows icon and select Correlations in the dropdown menu.


The tool shows words with correlating frequencies. A positive coefficient means that when the frequency of one word increases or decreases, the same happens to another word to the same extent; a negative coefficient means that when the frequency of one word increases, the frequency of another decreases, and vice versa. In the Scale tab, you can choose to display statistics for the entire corpus or only for individual documents.

The Summary panel, located in the first tab of the bottom left corner, provides general information about the corpus and all documents in it.


The Documents tab in the bottom left corner shows document length statistics, the number of unique words, or types, in every document, the ratio of unique words to the total number of words (Ratio column) and the average sentence length.

The Phrases tab in the bottom left corner provides information about the N-gram frequency. N-grams are combinations of N words (1, 2, 3, 4 etc.) You can set the length of N-grams using the Length slider.

The Library proactively supports and enhances the learning, teaching, and research activities of the University. The Library acts as a catalyst for your success as University of Galway’s hub for scholarly information discovery, sharing, and publication.
Library
University of Galway
University Road,
Galway, Ireland
T. +353 91 493399